return to the main page "Calculus I for Management"
return to the section "Curves & Optimization"
Worked-Out Exercises: Properties of curves
The following set of exercises is given together with hints, solutions, and solution paths. They are designed such that
you can first try to solve them and in case you need help, please, open the "hints" section. For checking your
answer, please, open the "solution" section and for getting more details or checking your way of solving the
exercise, please, open the "solution path" section.
|
|
|
Exercise 1: Graphing Using a Derivative |
| |
|
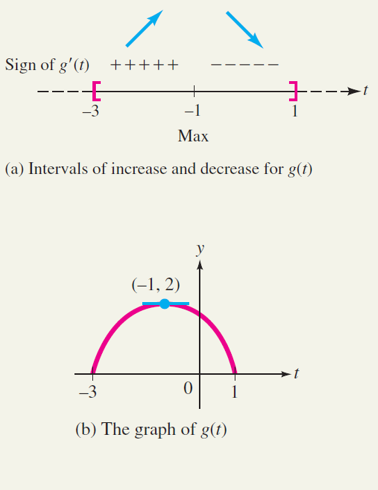
Find the intervals of increase and decrease and the relative extrema of the following function and sketch its graph:
$$
g(t) \, \, = \, \, \sqrt{3 - 2t - t^2} \, .
$$
|
|
 Hint Hint
(please, click on the "+" sign to read more)
Find the defined range of \(g(t)\), simplify derivative with chain rule and find critical points.
|
|
Solution
(please, click on the "+" sign to read more)
Increasing at the interval: \(-3 < t < -1\)
Decreasing at the interval: \(-1 < t < 1\)
\(g(-3) = g(1) = 0\) and \(g(-1)=2\)
There is a relative maximum at \((-1, 2)\)
|
|
Solution Path
(please, click on the "+" sign to read more)
Since \(\sqrt{u}\) is defined only for \(u \geq 0\), the domain of \(g\) will be the set of all \(t\) such that
\(3-2t-t^2 \geq 0\). Factoring the expression \(3-2t-t^2\), we get
$$
3 - 2t - t^2 \, \, = \, \, (3+t) (1-t)
$$
Thus, \(g(t)\) is defined only for \(-3 \leq t \leq 1\). Next, with the chain rule, we obtain
$$
g'(t) \, \, = \, \, \frac{-2-2t}{2 \cdot \sqrt{3-2t-t^2}} \, \, = \, \, \frac{-1-t}{\sqrt{3-2t-t^2}}
$$
$$
g'(t) \, \, = \, \, \frac{-1-t}{\sqrt{3-2t-t^2}}
$$
Note that \(g'(t)\) does not exist at the endpoints \(t=-3\) and \(t=1\) of the domain of
\(g(t)\), and that \(g'(t)=0\) only when \(t=-1\).
Next, mark these three critical numbers on a number line restricted to the domain of
\(g(t)\), \(-3 < t < -1\), and determine the sign of the derivative \(g'(t)\) on the subintervals
\(-3 < t < -1\) and \(-1 < t < 1\) to obtain the arrow diagram.
Finally, we compute \(g(-3) = g(1) = 0\) and \(g(-1)=2\) and observe that the arrow diagram
suggests there is a relative maximum at \((-1, 2)\).
|
|
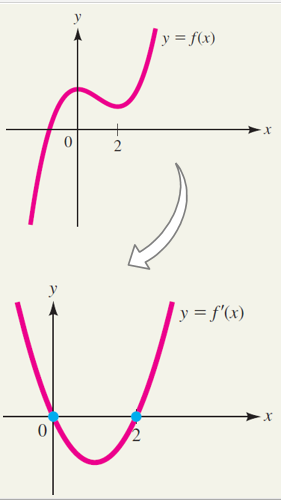
Exercise 2: Using the graph of f to graph the derivative \(f\) |
| |
The graph of a function \(f(x)\) is shown. Sketch a possible graph for the derivative \(f'(x)\).

|
|
Hint
(please, click on the "+" sign to read more)
Remember that for \(x\) in \(f(x)\), if \(x\) is decreasing \(f'(x)\) is below \(x\)-axis
Also, when \(f(x)\) is "flat" at \(x\), \(f'(x) = 0\)
|
|
Solution
(please, click on the "+" sign to read more)
|
|
Solution Path
(please, click on the "+" sign to read more)
Since the graph of \(f(x)\) is falling for \(0 2\), the graph of \(f(x)\) is rising, so \(f'(x)>0\) and
the graph of \(f'(x)\) is above the \(x\)-axis on both these intervals.
The graph of \(f(x)\) is 'flat' (horizontal tangent line) at \(x=0\) and \(x=2\), so
\(f'(0) = f'(2) = 0\), and \(x=0\) and \(x=2\) are the \(x\)-intercepts of the graph of \(f'(x)\).
The figure shows one possible graph that satisfies these conditions.
|
|
Exercise 3: Using the graph of a derivative \(f(x)\) to graph \(f(x)\) |
| |
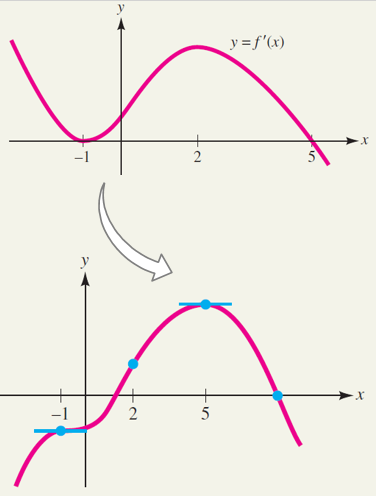
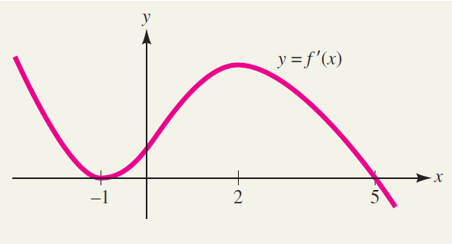
The graph of the derivative \(f'(x)\) of a function \(f(x)\) is shown in the figure.
Find intervals of increase and decrease and concavity for \(f(x)\), and locate all relative
extrema and inflection points. Then sketch a curve that has all these features.
|
|
Hint
(please, click on the "+" sign to read more)
Note down the features of \(y = f'(x)\) and \(y = f(x)\) at every interval to come up with meaningful solution
|
|
Solution
(please, click on the "+" sign to read more)
|
|
Solution Path
(please, click on the "+" sign to read more)
First, note that for \(x<-1\), the graph of \(f(x)\) is above the \(x\)-axis, so \(f'(x)>0\) and
the graph of \(f(x)\) is strictly monotonously increasing. The graph of \(f(x)\) is also strictly monotonusly decreasing for \(x<-1\), which means
that \(f''(x)<0\) and the graph of \(f(x)\) is concave down. Other intervals can be analyzed
in a similar fashion, and the results are summarized in the table.
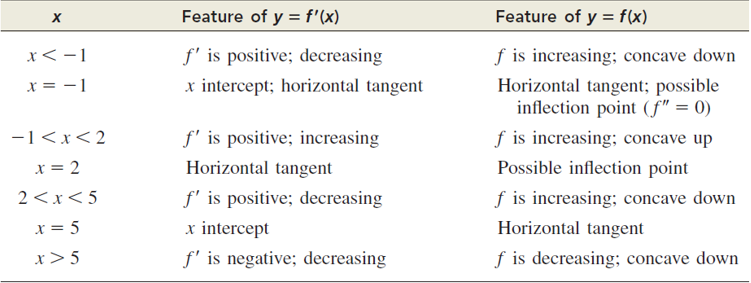
Since the concavity changes at \(x=-1\) (down to up), an inflection point occurs there,
along with a horizontal tangent. At \(x=2\), there is also an inflection point (concavity
changes from up to down), but no horizontal tangent. The graph of \(f(x)\) is rising to the
left of \(x=5\) and falling to the right, so there must be a relative maximum at \(x=5\).
One possible graph that has all the features required for \(y=f(x)\) is shown in
the figure. Note, however, that since you are not given the values of \(f(-1)\), \(f(2)\),
and \(f(5)\), many other graphs will also satisfy the requirements.
|
|
|
|
Copyright Kutaisi International University — All Rights Reserved — Last Modified: 12/ 10/ 2022
|
|
|